
Ask any researcher what “Scopus indexed” means, and you’ll get a confident answer. Ask how CiteScore is calculated and the room goes quiet.
That gap matters more at the start of a career than at any other point. Promotions, probation reviews, funding decisions and doctoral committee approvals are increasingly made on the strength of numbers that most of us have never bothered to open up. Worse, the numbers get quoted at us by people who have not opened them up either. A senior colleague telling you to “aim for Q1” may not know that the journal they have in mind is Q1 in one classification and Q3 in another, both correct.
So let’s open them up. Every metric in this piece is arithmetic. None of it is difficult. What follows is what each number counts, what it deliberately ignores and where it will mislead you if you take it at face value.

First, what Scopus actually is
Scopus is Elsevier’s abstract and citation database. It holds around 28,000 active peer-reviewed titles, organized into 27 major subject areas that subdivide into more than 300 narrower categories. Alongside journals it indexes conference proceedings and book series, which matters if you work in computer science or in fields where edited volumes carry weight.
It is not a quality stamp. This is the single most common misunderstanding and it is worth being blunt about. Scopus is a record of what was published and who cited whom. Every metric described below is arithmetic performed on that record. A journal being indexed tells you it cleared an administrative and bibliometric threshold. It does not tell you the peer review was rigorous, that the editorial board is active or that your paper will be read.
How journals get in
An independent Content Selection and Advisory Board reviews titles against published criteria. Broadly, these cover the existence and description of a peer-review policy, the academic contribution to the field, clarity of abstracts and English-language titles, quality and diversity of the editorial board, regularity of publication and citedness in Scopus. Journals apply, and the board evaluates. Publishers cannot purchase inclusion.
This last point is worth holding onto, because it is the specific claim that predatory publishers invert. A journal advertising “guaranteed Scopus indexing” for a fee is describing something that does not exist.
How journals get out
Titles are also removed, for publication concerns, quality concerns or metadata failures. Scopus maintains a public discontinued-titles list. Check it before you submit anywhere, particularly for journals recommended to you second-hand or found through a solicitation email.
The practical risk here is specific and painful. A journal can be indexed on the day you submit and discontinued by the time your article appears and coverage is not retroactive in the way authors assume. Verify by ISSN in the official Scopus Source List rather than by journal name, because predatory titles frequently mimic the names of legitimate indexed journals.
What Scopus does not cover well
Coverage is strongest in the sciences and weakest in the humanities, in non-English scholarship and in monographs. Regional and vernacular journals are systematically underrepresented. If your field publishes substantially in books, or in languages other than English, or in local journals that serve a real scholarly community, Scopus will undercount you. That is a property of the database, not a verdict on your work and it is a legitimate thing to say out loud in an assessment conversation.
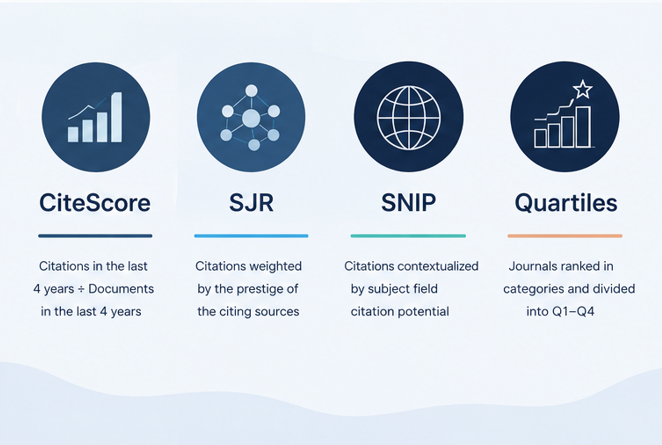
With that established, here are the four numbers you will actually encounter.

CiteScore: the simple one
CiteScore is the metric Scopus puts front and centre, and it is the easiest to verify for yourself.
CiteScore 2025 = citations received in 2022–2025 ÷ documents published in 2022–2025
Both halves count the same five document types: articles, reviews, conference papers, book chapters and data papers. Editorials, news items, letters and errata are excluded from the top and the bottom of the fraction alike.
A worked example
A journal publishes 400 qualifying documents between 2022 and 2025. Those documents collect 1,200 citations within that same window. Its CiteScore is 1,200 ÷ 400 = 3.0.
That is the entire calculation. There is no weighting, no adjustment, no proprietary step. If you have the two numbers, you have the metric.
Why the four-year window matters
The Impact Factor uses a two-year window. CiteScore uses four. This is not a trivial difference, and it favours particular disciplines in a way worth understanding.
In molecular biology, a paper accumulates most of its citations quickly. A two-year window captures that. In history, sociology, media studies or law, a paper may take three or four years simply to be noticed, and its citation peak may fall well outside a two-year window. The longer window gives slow-citing fields a fairer reading of the same underlying behaviour.
There is a subtlety inside the window that is rarely discussed. Documents published in 2022 have four years to accumulate citations within the 2022 to 2025 window. Documents published in 2025 have almost none. The metric is therefore weighted, structurally, toward a journal’s older content. A journal that has recently improved will look worse than it is. A journal in decline will look better than it is. Neither effect is a flaw exactly, but both are worth knowing when you are comparing two journals whose trajectories differ.
Why the matching document types matter
This is the design feature that separates CiteScore from the Impact Factor and it is the one most worth understanding.
The Impact Factor counts citations to everything the journal published in its numerator, including editorials, letters and news items. But its denominator counts only “citable items,” which in practice means articles and reviews. The two halves do not match. A journal that publishes a great many editorials, which attract citations but are not counted as documents, can inflate its Impact Factor without publishing better research. Negotiations between publishers and the indexer over which items count as citable are a documented feature of the landscape.
CiteScore closes this door by using identical document types on both sides. You cannot game it by reclassifying content, because reclassification changes both halves at once.
You can also calculate it yourself from publicly visible data, which is not true of the Impact Factor. For an early-career researcher being told to target a particular number, the ability to check the number independently has real value.
CiteScore Tracker and CiteScore percentile
Between annual releases, Scopus displays a CiteScore Tracker that updates monthly. It shows the metric as it currently stands for the in-progress year. It is an indication of direction, not a final value and it should not be quoted as though it were settled.
Scopus also reports a CiteScore percentile, which places the journal against others in its subject category. This is the figure from which Scopus quartiles are derived, and it is generally more informative than the raw CiteScore, because a CiteScore of 3.0 means something entirely different in oncology than in philosophy.
SJR: not all citations are equal
CiteScore treats every citation identically. A citation from a leading journal in your field and a citation from a journal nobody reads count exactly the same. SCImago Journal Rank asks a different question: who is doing the citing?
How prestige flows
SJR is derived from the PageRank algorithm, the method Google originally used to rank web pages. The underlying intuition transfers cleanly. A web page is important if important pages link to it. A journal is prestigious if prestigious journals cite it.
Mechanically, each journal begins with a baseline prestige value. Citations transfer some of that value from the citing journal to the cited one. The calculation then repeats across multiple cycles until the values stabilize, which resolves the circularity in the definition. The accumulated prestige is finally divided by the number of citable documents, so that a large journal does not score highly merely by publishing a great deal.
SJR runs on a three-year citation window.
The closeness refinement
The version in current use, originally published as SJR2, adds a second consideration. It weighs not only the prestige of the citing journal but its subject closeness to the cited journal, measured through the cosine of the angle between the two journals’ co citation profiles.
In plain terms: a citation from a closely related journal counts for more than a citation from a distant one. This is a deliberate correction. A methods paper cited widely across unrelated fields is doing something different from a paper cited intensively within its own specialism and SJR2 tries to distinguish them.
The self-citation cap
SJR restricts a journal’s self-citations to a maximum of 33% of its issued references. Normal self-citation, which is a legitimate feature of a specialized journal building on its own published work, passes through untouched. Systematic self-citation intended to inflate the score does not.
Reading the divergence
The most useful thing you can do with SJR is compare it against CiteScore for the same journal. When a journal has a high CiteScore and a comparatively low SJR, it is being cited often but by sources that do not themselves carry much weight. When SJR is high relative to CiteScore, the journal is being cited less frequently but by more consequential venues.
Neither pattern is automatically better. But if you are choosing between two journals with similar CiteScores, the one with the higher SJR is reaching the readers who matter in your field.
SNIP: correcting for your field
SJR adjusts for who cites you. SNIP adjusts for the field you are in, which is a problem the other two metrics ignore entirely.
The problem
Molecular biologists cite far more heavily than film scholars do. This is not because biology is more important. It is because disciplinary conventions differ: reference list lengths, publication rates, the size of the citing community and how quickly work matures all vary enormously across fields.
Comparing raw citation counts across those fields tells you about disciplinary convention, not about impact. A CiteScore of 8 in a life sciences journal and a CiteScore of 2 in a humanities journal may represent identical performance relative to their respective fields.
Citation potential
Source Normalized Impact per Paper corrects for this by dividing a journal’s citations per paper by the citation potential of its subject field.
Citation potential develops an observation Eugene Garfield made decades ago: the average length of reference lists in a field determines the probability of any given paper being cited there. If papers in your field routinely cite 60 works, there are simply more citations circulating than in a field where papers cite 25. SNIP measures this from the reference lists of the papers doing the citing, then normalises accordingly.
The average across the whole of Scopus is set to 1.0.
What a SNIP value means
A journal with a SNIP of 1.4 receives 40% more citations per paper than the average journal in its field would be expected to receive. A journal with a SNIP of 0.7 receives 30% fewer.
This is what makes cross-field comparison possible at all. A media studies journal with a SNIP of 1.4 and a biomedical journal with a SNIP of 1.4 are each beating their own field’s norms by the same margin, even though their raw citation counts would be nowhere near each other.
If you work in a low-citation discipline, SNIP is the metric that will represent you fairly, and it is the one to cite when your work is being assessed against colleagues in high-citation fields.
One caveat on the literature
SNIP was introduced by Henk Moed in 2010. The calculation was revised in 2012 by the team at Leiden’s Centre for Science and Technology Studies, and the values reported in Scopus have used the revised method since October 2012. If you read Moed’s original paper, which remains the clearest account of the concept, be aware that the operational formula has since changed in its details.
Quartiles and a common confusion
Q1 sounds absolute. It is not and the gap between how the term is used and what it means causes more confusion than any other item in this piece.
What a quartile is
A quartile is a journal’s position within a specific subject category. The journals in that category are ranked by a metric and the ranking is divided into four equal groups. Q1 is the top 25%, Q4 the bottom.
Note what this means: Q1 is defined relative to a category, not to scholarship in general. A Q1 journal in a small, narrow category may have a lower absolute citation rate than a Q3 journal in a large, active one.
The two-source trap
Here is the trap that catches people most often.
Scopus quartiles are derived from CiteScore percentile. SCImago quartiles are derived from SJR. These are different metrics measuring different things, so the same journal can sit in different quartiles depending on which source you consult. Both are correct. Neither is lying.
The multi-category trap
Journals are classified into multiple subject categories. A journal on digital media might appear under Communication, under Cultural Studies and under Computer Science Applications, with a different quartile in each.
People naturally quote the most flattering one. This is not always dishonest, but it is always incomplete.
How to interrogate a Q1 claim
When someone claims Q1, two follow-up questions are entirely fair and entirely polite:
- By which metric? CiteScore percentile or SJR?
- In which category and how large is that category?
If you are the one making the claim, state both up front. It takes six words and it forecloses the question. Predatory journals advertising “Q1” without naming a source or category are relying on your not asking.
The h-index
The three metrics above describe journals. The h-index describes you and it is the number most likely to appear in your own assessment file.
The definition
Your h-index is h if you have h papers that have each been cited at least h times.
Worked through: if you have published 20 papers, and 10 of them have been cited at least 10 times each, while the eleventh has been cited 9 times, your h-index is 10. Publishing more papers that are never cited will not move it. Accumulating more citations on your single most-cited paper will not move it either.
What it rewards
The h-index was designed to punish two failure modes at once. It penalises the one-hit wonder, whose single celebrated paper cannot lift an otherwise thin record. And it penalises the prolific-but-uncited author, whose long publication list contains nothing anyone builds on. To move it, you need sustained work that is sustainedly used.
That is a reasonable thing to want to measure. The problems are in what it cannot help doing alongside.
Four limitations worth knowing
It rises with career length and never falls. The h-index is monotonic. A decade-in professor will almost always exceed a recent PhD and that comparison tells you mostly about time elapsed. Any assessment that compares raw h-indices across career stages is measuring seniority.
It is field dependent. Citation densities vary as described in the SNIP section, and the h-index applies no correction whatsoever. An h-index of 15 means something very different in genomics than in medieval history.
It is database dependent. Your h-index in Scopus, in Web of Science and in Google Scholar will differ, sometimes substantially, because each indexes a different corpus. Google Scholar generally returns the highest figure because it captures the widest range of sources, including some of doubtful quality. When you report an h-index, name the database. When you read one, ask.
It ignores author contribution. A paper with forty authors counts the same as a sole-authored monograph-length article. In fields with large collaborations, this is a significant distortion.
Variants you may encounter
The m-quotient divides h by the number of years since your first publication, which partially addresses the career-length problem. The g-index gives additional weight to highly cited papers. The i10-index, reported by Google Scholar, simply counts publications with at least ten citations.
None of these is standard. If your institution asks for one specifically, use that one and say which.
When your institution’s criteria do not fit your field
This is the situation early-career academics in India actually face and no metric solves it on its own.
Promotion and API-style criteria are frequently written with sciences in mind and applied uniformly. If you are in media studies, education, humanities or the qualitative social sciences, you may be assessed against thresholds calibrated to fields that cite three times as heavily as yours.
Three things are worth doing.

Report the field-normalised figure alongside the raw one. If your journal’s CiteScore looks unimpressive in absolute terms, its SNIP and its CiteScore percentile within category may tell a different and more accurate story. Present both. The percentile in particular is difficult to argue with, because it is explicitly a within-field comparison.
Name the category and the source. Do not write “Q1.” Write “Q1 by CiteScore percentile in Communication, Scopus, 2025.” This is more persuasive, not less, because it demonstrates that you understand what the claim rests on.
Cite the frameworks. The San Francisco Declaration on Research Assessment and the Leiden Manifesto are the two documents that make the argument you need, and both are short enough to read in a sitting. Elsevier, which owns Scopus, is itself a DORA signatory. That is a useful fact to have available when the metrics being used against you come from Elsevier’s own database.
What none of these measures
Not rigour. Not originality. Not methodological care. Not whether anyone acted on your findings, changed a policy, taught differently, or built something because of what you wrote.
These metrics count citations. Citations are a proxy for attention, and attention is a weak and lagging proxy for value. Papers are cited for being wrong. Papers are cited without being read. Foundational work stops being cited once it becomes assumed knowledge, which means the most influential papers in a field can end up looking inert.
Elsevier signed DORA in 2020. The declaration argues explicitly against using journal-level metrics as a proxy for the quality of individual research articles or for assessing individual researchers. The Leiden Manifesto makes a complementary case, insisting that quantitative evaluation support expert judgement rather than replace it.
Use these numbers to choose where to publish. That is what they are good for, and they are genuinely good for it. Be far more careful about letting them decide who deserves what.
Where to start reading
If you read only two of the sources below, make them Moed (2010), which is where SNIP comes from and is unusually clear about its own limitations, and Hicks et al. (2015), which is the one-page argument you will want when a committee asks you to justify a journal choice.
References
Elsevier. (n.d.). Metrics: Scopus LibGuide. Retrieved July 28, 2026, from https://elsevier.libguides.com/scopus/metrics
Elsevier. (2020, December 16). Advancing responsible research assessment. https://www.elsevier.com/connect/advancing-responsible-research-assessment
González-Pereira, B., Guerrero-Bote, V. P., & Moya-Anegón, F. (2010). A new approach to the metric of journals’ scientific prestige: The SJR indicator. Journal of Informetrics, 4(3), 379–391. https://doi.org/10.1016/j.joi.2010.03.002
Guerrero-Bote, V. P., & Moya-Anegón, F. (2012). A further step forward in measuring journals’ scientific prestige: The SJR2 indicator. Journal of Informetrics, 6(4), 674–688. https://doi.org/10.1016/j.joi.2012.07.001
Hicks, D., Wouters, P., Waltman, L., de Rijcke, S., & Rafols, I. (2015). Bibliometrics: The Leiden Manifesto for research metrics. Nature, 520(7548), 429–431. https://doi.org/10.1038/520429a
Hirsch, J. E. (2005). An index to quantify an individual’s scientific research output. Proceedings of the National Academy of Sciences, 102(46), 16569–16572. https://doi.org/10.1073/pnas.0507655102
Moed, H. F. (2010). Measuring contextual citation impact of scientific journals. Journal of Informetrics, 4(3), 265–277. https://doi.org/10.1016/j.joi.2010.01.002
San Francisco Declaration on Research Assessment. (2012). San Francisco Declaration on Research Assessment. https://sfdora.org/read/
SCImago. (n.d.). SJR: Methodology. Retrieved July 28, 2026, from https://www.scimagojr.com/methodology.php
Waltman, L., van Eck, N. J., van Leeuwen, T. N., & Visser, M. S. (2013). Some modifications to the SNIP journal impact indicator. Journal of Informetrics, 7(2), 272–285. https://doi.org/10.1016/j.joi.2012.11.011
To know more please visit: https://cmprindia.org/blog-media-research/
Author: Anushka Kulkarni